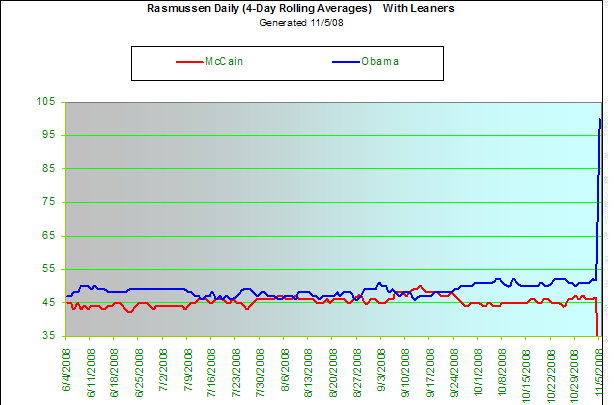
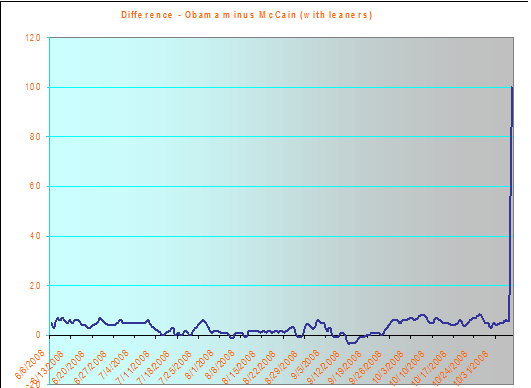
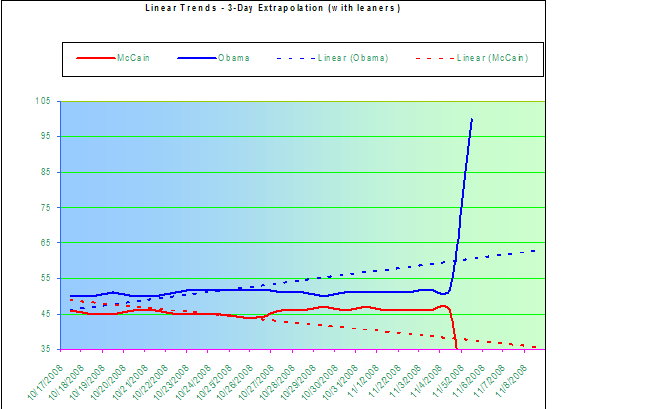
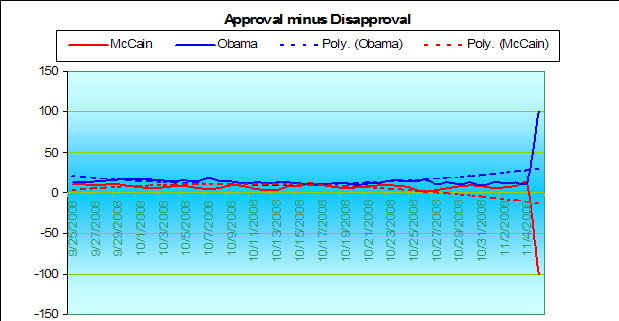
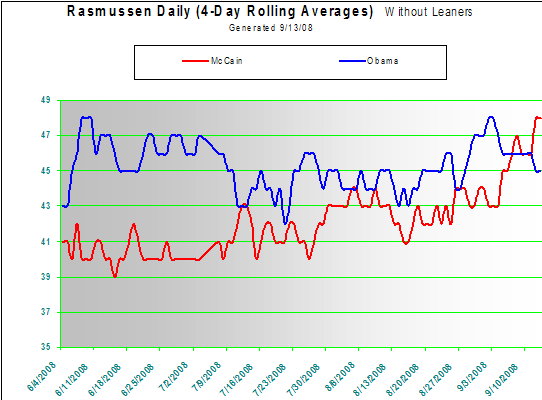
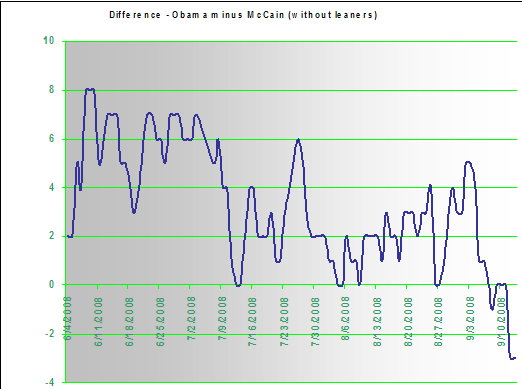
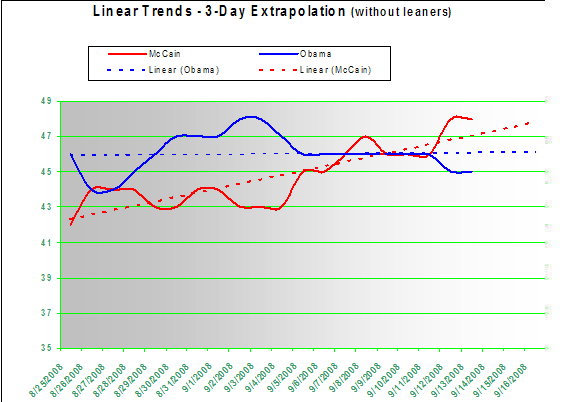
These graphs are taken from the daily tracking data published by the Rasmussen polling organization.
Suggestions for making the graphs more useful are welcome.
Rasmussen stopped tracking the "without leaners" numbers on 9/13/08. The following are the "without leaners" polls up to that point.
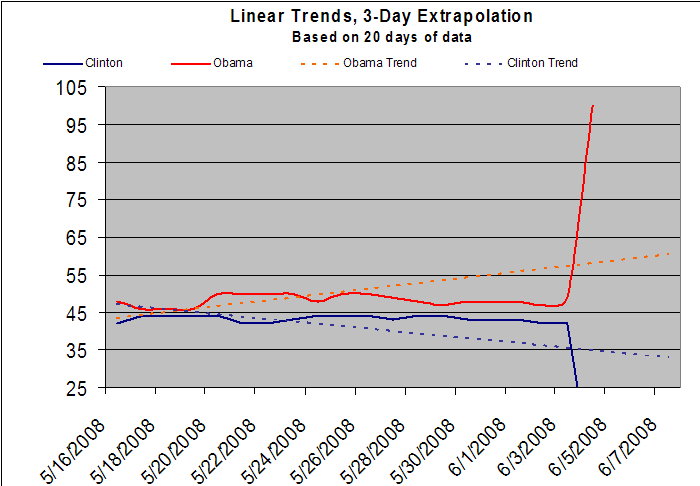
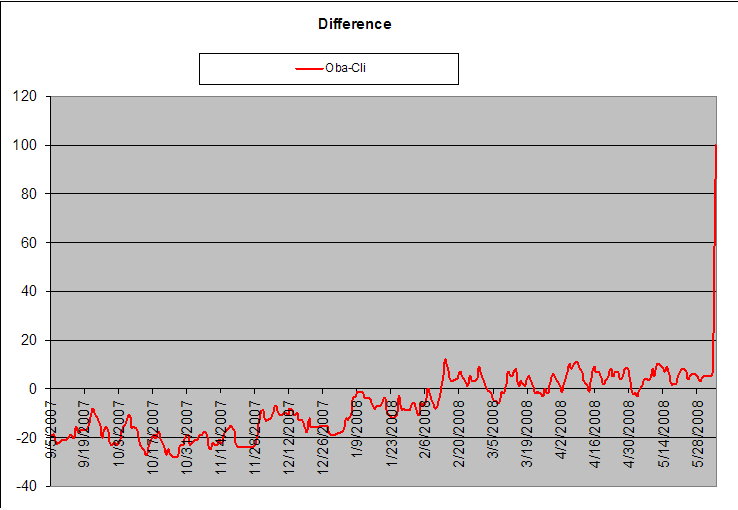
The graphs below are from the primary season. They were updated for the last time on 6/4/08.
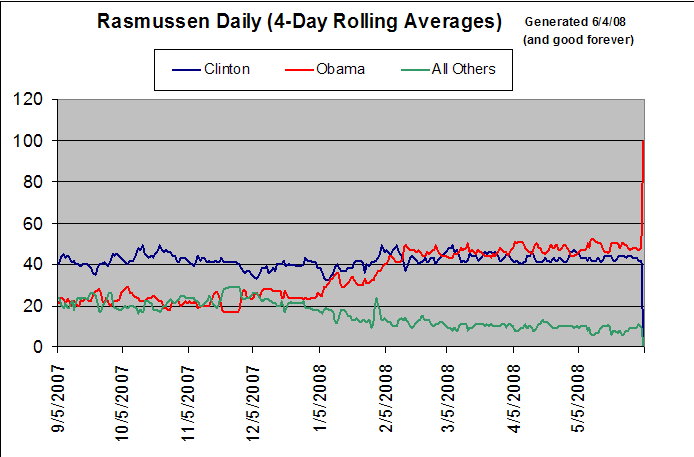
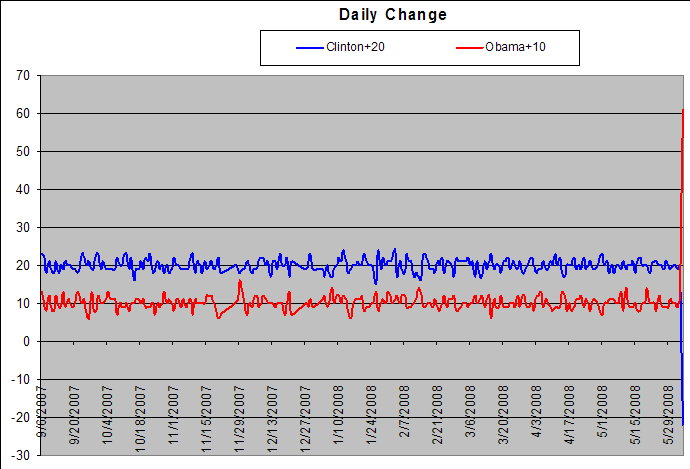
(Pretend that the 10 and 20 lines are actually 0. Does anyone know how to make Excel label different parts of the Y axis differently?)